

SEASONALITY OF THE HURRICANE RISK IN INSURANCE-LINKED SECURITIES
The main hurricane risk of insurance-linked securities, that of North Atlantic hurricanes, is seasonal as opposed to following uniform distribution. The hurricane season officially starts on June 1 and ends November 30. Very few hurricanes occur outside the hurricane season. Approximately 97% of all tropical storm activity happens during these six months.As the the above diagram, there is a pronounced peak of activity within the
hurricane season, which lasts from August through October. Over three quarters
of storms occur during this period. The percentage of hurricanes, in
particular major hurricanes, is even greater: more than 95% of major hurricane
(Category 3 and greater) days fall from August through October.
Definition of hurricane season is rarely used in the offering documents for
insurance-linked securities. Instead, specific dates determine the coverage
period. Knowing when the hurricane season officially starts and ends is not
relevant. However, there are some insurance-linked securities for which the
definition of the hurricane season is important. Exchange-traded IFEX catastrophe
futures use a formal legal definition of North Atlantic hurricane season.
This definition is used in establishing maintenance margin levels for
IFEX contracts. Catastrophe futures and similar insurance-linked securities
are described in detail in other chapters.
Hurricanes threatening the Pacific coast of the US and Mexico have a
longer period of heightened activity, which starts earlier than on the Atlantic
coast but has the same activity peak as the North Atlantic hurricanes. West
Pacific hurricanes are distributed even more evenly over the year; they are
less important in securitisation of insurance risk.

Hurricanes in the Southern Hemisphere (called typhoons or cyclones
there) tend to occur between October and May, but specific frequency distributions
depend on ocean basin.
LANDFALL FREQUENCY IN PEAK REGIONS
threat in the southeastern US, The following two figures illustrate hurricane
landfall frequencies expressed as return periods. Unlike the figures
above, only landfalls – which typically are the only hurricane risk in insurance-
linked securities – are shown, with the two graphs corresponding to
hurricane Categories 1 and 5 on the Saffir–Simpson hurricane scale.
Return period is defined here as the long-term average of a recurrence
interval of hurricane landfalls of specific or greater intensity (category) at the
time of landfall. It can also be seen as the inverse of the annual exceedance
probability. Return period is usually measured in years.
Historical data is the best indicator of future hurricane frequencies. Of
course, this does not mean that a simple sampling of the historical frequencies
should be used in hurricane simulations. It means only that historical
data is the starting point of any model, which is also where we return to validate
the model once it has been built. A sound model is much more than just
fitting of a distribution to the existing data points; some extremely sophisticated
models have been created in recent years.


HURRICANE FREQUENCY AND SEVERITY EFFECTS OVER VARIOUS
TIME HORIZONS
Continuing to focus primarily on hurricanes affecting the US, three primaryphenomena affect hurricane frequency and severity, each operating over its
own time scale: short term, medium term and medium to long term.
1 Short term
ENSO, which stands for El Niño Southern Oscillation, is the cycle of consistentand strong changes in sea surface temperature, air pressure and winds
in the tropical Pacific Ocean. The two phases, El Niño and La Niña, typically
take three to five years to complete the cycle.
El Niño is the warm phase of the cycle, when the sea surface temperature in the tropical Pacific is above average. Its opposite, La Niña, is the phase when the temperatures are below
average. The warming and cooling affect the level and patterns of tropical
rainfall, which in turn has an effect on worldwide weather patterns and
hurricane frequency and severity.
El Niño is associated with lower-than-average tropical storm and hurricane
activity in the Northern Atlantic due to higher-than-average vertical
wind shear resulting fromthewind patterns during this phase of ENSO. The
probability of hurricanes and hurricane landfalls in the Caribbean and other
parts of the North Atlantic is significantly reduced during the regular hurricane
season.
At the same time, the weather patterns lead to an increase in
tropical storms and hurricanes in the eastern tropical North Pacific.Results of
the La Niña phenomenon are the opposite: storm formation and hurricane
activity are increased in the North Atlantic during the hurricane season,while
in the Pacific the probability of hurricanes is lower than average. These two phases of ENSO are not equal in time.
El Niño rarely lasts longer than one year, while La Niña tends to take between one and three years. There is no strict cyclicality here, in the sense that each of the two phases can have shorter or much longer durations than expected. The general relationship, however,
usually holds, with periods of increased hurricane activity in the Atlantic
being longer than periods of decreased activity.
Technically speaking, El Niño and La Niña are not truly two phases of the
ENSO cycle. The end of El Niño leads to an ENSO-neutral period, which
may not be followed by a pronounced La Niña phenomenon and can
instead go back to the El Niño stage. Similarly, La Niña may not be followed
by a pronounced El Niño stage.
ENSO affects not only the frequency but also the severity of hurricanes.
One reason for this is the vertical wind shear effect, where hurricane intensity in the Atlantic is dampened during El Niño and increased during La
Niña. In addition, the tropical storm formation centres differ slightly and the
hurricanes follow different tracks. La Niña results not only in a greater
frequency of hurricanes in the Atlantic but also in a greater probability of
hurricanes being formed off the west coast of Africa. These hurricanes have
a higher chance of increasing in intensity and making a landfall in the US or
Caribbean as major hurricanes.
The following figure shows an anomalous increase in sea surface temperature
indicative of the arrival of El Niño and the expectation of lower hurricane
activity in the Atlantic.
2 Medium term
AMO, which stands for Atlantic Multidecadal Oscillation, is a cycle ofconsistent and strong changes in sea surface temperature in the North
Atlantic. The cycle is believed to be on the order of 70 years, with the up and
down phases approximately equal in time. The amplitude of the temperature
variations due to the AMO is much milder than that resulting from
ENSO, and the changes much slower. It is believed that we are currently in of the warm phase. This phase is expected to end between 2015 and 2040.

hurricanes, with warmer temperatures contributing to the tropical storm
system development and colder temperatures leading to a reduction in tropical
storms.
This correlation is not strong and the effect is usually
disregarded. However, during the warm phases of the cycle there is a
greater chance of major hurricanes compared with the average; the chance
is lower during the cold phases. This effect is unambiguous and the correlation
is strong.
3 Medium to long term
Climate change, in particular the increase in seawater temperature, has astrong potential to increase both the frequency and the severity of the hurricanes
landfalling on the Atlantic coast of the US. Some of the change is the
result of human activities.
Global warming, recognised by the majority of
the scientific community, is part of the overall climate change. There is no
consensus on the exact manifestations of and the speed at which climate
change is happening. Some would argue that categorising climate change as
having medium- to long-term effect is wrong, and that substantial changes
are already happening rapidly and will accelerate.
The risk of abrupt climate change triggered by concurrent development of several factors has been repeatedly pointed out. Even those who subscribe to the global-warming
view without any reservations are unclear on the long-term effects of this
process. In fact, some research has suggested that the increase in the
seawater temperature will lead to a significant increase in hurricane activity
in the North Atlantic, but that at some point the process will reverse itself
and the hurricane frequency will actually decrease even if the temperature
continues to rise. This, however, is a minority opinion.
While global warming remains a controversial topic, in particular because
different people seem to attribute different meanings to the term, it is widely
accepted that seawater temperature has been rising and that the probability
of hurricanes in the North Atlantic is increasing as a consequence. This
correlation has direct applications for hurricane modelling.
INVESTOR VIEWS ON MACRO-SCALE FREQUENCY AND SEVERITY EFFECTS
In the analysis of catastrophe insurance-linked securities tied to the risk ofhurricanes, investors have a short-term view due to the relatively short tenor
of these securities. Whether the probability of hurricanes will be greater in
15 years is not germane to the probabilistic analysis of cashflows from a catastrophe bond that matures in two years. To the degree that long-term phenomena such as climate change are already affecting the probability of hurricanes, they are relevant to and should be incorporated in the analysis.
The difficulty is in having to work with very limited data samples, because,
sometimes, these can provide only anecdotal evidence of the degree to
which long-term processes are already affecting hurricane development and
will continue to do so within the period an insurance-linked security is
expected to remain outstanding.
In practice, it is currently very difficult to
separate and then separately model effects of the general climate change.
Shorter-term effects such as ENSO, on the other hand, can be better
modelled and incorporated in the analysis. To a lesser degree, the same is
true in regard to AMO. Other processes, such as the overall warming related
to climate change, are often incorporated indirectly through their influence
on the observed parameters of the better-understood processes of storm
formation and development.
There is a broad issue of whether, and to what degree, catastrophe models
should reflect the observed increase in hurricane activity in the North
Atlantic. Following Katrina and the 2004–2005 hurricane seasons in general,
there was an almost universal conviction that the frequency of hurricanes in
the widely used commercial models was significantly understated.
(There were also concerns about how other modules of the models performed, and
whether the damage and loss severity were understated.) Since then, the
models have been modified to produce loss results that are greater than
would be expected based purely on long-term historical data, either as the
main output or as an option available to the user.
The change reflects the view that the long-term observations do not represent the current atmospheric conditions that affect formation, development and landfalling of
tropical storms and hurricanes. This important practical issue is discussed
further below and in other articles.
Incorporating short-term effects such as ENSO in both the models and the
general analytical approach can better capture the risk profile of insurancelinked
securities and provide competitive advantage to investors able to do
it. For example, if El Niño starts, which can happen fast and unexpectedly,
short-term probabilities of North Atlantic hurricane losses will immediately
be affected. This affects the risk profile of the insurance-linked securities
exposed to this risk.
The knowledge of lower expected hurricane activity has
immediate application in pricing new insurance-linked securities and those
that can be traded in the secondary markets. Another practical application is
reassessing portfolio risk and return profile in light of the information on El Niño’s start. This reassessment might identify a change in the risk and
return profile of the overall ILS portfolio. The practical result would be a
conclusion regarding which risk buckets have to be filled and which
reduced, and the right prices for doing so.
Knowledge of expected changes in hurricane activity in the short term,
along with the ability to quantify the degree of the change, can create a
competitive advantage in the environment when many investors are not
using proper models at all and few are able to incorporate new information
in their modelling process.
With some exceptions, quantifying the impact of
new information such as the start of El Niño is not performed by the modelling
firms. Users of the models might have a view on the adjustments to
parameters that have to be made, but are unlikely to be able to properly
incorporate these changes in the standard modelling tools. This area is ripe
for improvement; new approaches are expected to be developed in the near
future. For now, some use adjustments made primarily on judgement. These
adjustments might or might not be implemented at the assumptions level,
as opposed to modifying the results of modelling.
The ability to reflect short-term frequency and severity effects of atmospheric
processes to properly assess risk is an advantage in trading
catastrophe bonds; it is an even greater advantage in investing in and
trading shorter-term instruments such as ILWs and catastrophe derivatives.
There is also a question of making better predictions of landfall probabilities
and associated losses of tropical storms that have already formed, which is
important in “live cat” trading; but these very short-term predictions have a
low degree of dependence on the macro-scale hurricane frequency effects
described here.
The discussion about reflecting macro-scale frequency effects in quantifying
the natural catastrophe risk in insurance-linked securities is irrelevant
to most investors, since they do not attempt to make any adjustments. Their
analysis might still capture some of these effects to the degree that the standard
modelling software packages used in catastrophe modelling might
give greater weight to recent years, as opposed to being calibrated based
simply on the long-term historical record of observations.
While this approach on the part of investors is inadequate and easy to criticise, it
reflects the degree of difficulty of determining and quantifying the effects of
macro-scale atmospheric processes on hurricane activity. A high level of
expertise is required to do it properly, and there is a significant degree of
uncertainty associated with these adjustments.
EVOLUTION OF INVESTOR VIEWS ON CATASTROPHE MODELLING
Incorporating short-term effects in catastrophe modelling has grown inimportance over time. Given that, for catastrophe bonds, buy-and-hold used
to be the only investment strategy, modelling was often performed only
once. Investors rarely tried to perform any real modelling and relied fully on
the analytical data in the offering circulars.
Many did not do even that and
based their investment decisions on other considerations, of which bond
ratings were the most important. Of course, even then there were investors
with deep understanding of insurance-linked securities; however, they
tended to be an exception rather than the rule. Even investors with a high
level of expertise in catastrophe risk, such as reinsurance companies, often
based the decisions on only a rudimentary overview of the summary
analysis provided in the offering circulars.
Some attempts to revisit the original
analysis would sometimes take place in the context of portfolio
construction, with a single focus on avoiding excessive risk accumulation in
some combinations of geographies and perils. Again, this statement is not
universally applicable, since from the very beginning some of the players in
the ILS market have been very sophisticated.
As the market has continued to develop, the level of sophistication of
many investors has grown with it, even though a significant disparity
remains. There are some ILS investors who lack any analytical expertise, and
some who believe they understand the analytics while in reality they do not.
In general, however, the current landscape is very different from what it
was in the beginning of the cat bond market. There are more new issues and
bonds outstanding. There is a sizable and growing secondary market for
catastrophe bonds.
This creates new opportunities for portfolio rebalancing
and optimisation. In addition, the ILW market has grown significantly.
Catastrophe derivative markets have reappeared and are growing as well.
Investors able and willing to take part in these markets and not be confined
to investing in catastrophe bonds have new options to generate higher riskadjusted
return by investing in catastrophe risk insurance-linked securities.
Direct hedging can be done in managing an ILS portfolio. The markets
remain inefficient and liquidity insufficient, but the array of options available
to investors has certainly expanded.
The ability to better model the risk has always been important in the
analysis of individual securities. The better tools now available for this
modelling have given investors a greater degree of confidence in the
analysis and opened new options not available several years ago.
RELATIONSHIP BETWEEN ILS INVESTOR SOPHISTICATION AND THE LEVEL OF ILS ANALYTICAL EXPERTISE
There is an obvious connection between the level of investor sophisticationand the ability to analyse the securities being invested. However, investing
in insurance-linked securities without being able to fully analyse them does
not necessarily put an investor in the “naïve” category.
There could be very good reasons for arriving at a well-thought-out decision not to expand
resources on developing internal expertise in insurance-linked securities,
but instead to allocate a small percentage of the overall funds to this asset
class without performing in-depth analysis.
One of the reasons could be the diversifier role that insurance-linked securities can play in a portfolio. Given a very small percentage allocation to ILS, for some investors the
cost–benefit analysis might not justify developing an expertise in this asset
class, though they may still have sufficient reasons for investing in ILS.
An even more important development stemming from the advances in modelling catastrophic events is the ability to better model and optimise portfolios of catastrophe insurance-linked securities. The new options available to investors – more new issuances; the development of secondary markets in catastrophe bonds, combined with a greater number of
outstanding bonds; the availability of ILWs and catastrophe derivatives,
both exchange-traded and over-the-counter – have also increased the need
for models that can be used in portfolio and risk management.
The shift from the buy-and-hold investment strategy as the only available option to
the ability, no matter how limited, to optimise and actively manage a portfolio
of insurance-linked securities is a sea change for a sophisticated
investor. Modelling insurance-linked securities on a portfolio basis has
increased the emphasis on modelling.
Some of the new modelling tools developed specifically for investors are described later in this article. A sophisticated investor can also take advantage of the live cat trading
opportunities arising when a hurricane has already formed and is threatening
an area that has significant insurance exposure. Short-term forecasts
can then be combined with broader portfolio modelling to take advantage
of the opportunities to take on risk at attractive prices, or to offload excess
risk in the portfolio.
So far, very little live cat trading has been done, but at least some growth in this area is expected. Improvement in the ability to model catastrophe risk contributes to the
development of the ILS markets. Enhanced tools give investors a higher
degree of confidence and open up new options.
At this point, however, most investors do not utilise the tools already available, and many make their investment decisions based primarily on judgement and a back-of-the-envelope
type of analysis. While there are some extremely sophisticated players
in this market, there is significant room for improvement in investor understanding
and modelling of catastrophe insurance-linked securities.
ELEMENTS OF HURRICANE MODELLING
Doubt is not a pleasant condition, but certainty is absurd.Voltaire
There is a very high degree of uncertainty associated with hurricane losses.
It surrounds all elements of a hurricane model – from the frequency and
location of storm formation to its tracks and intensity, and the possible landfall
and resulting insured losses. The very high degree of uncertainty has
been a continuing source of frustration for many investors who rely on the
output of black-box-type modelling tools such as the analysis summarised
in offering circulars for cat bonds.
It is even more frustrating for those fewinvestors for whom the modelling tools are not black boxes and who understand the assumptions and the modelling of individual processes within the broader analytical framework. Their superior understanding does not eliminate
the uncertainty and might even increase the perception of the degree
of uncertainty in their minds.
We need to keep in mind that the obvious uncertainty involved is not unique to insurance-linked securities tied to catastrophe risk: to some degree it is present in any security and financial instrument. Insurance-linked securities are unique in the type of risks they
carry; they are not unique in the carrying of risk per se. Every security carries
some degree of risk, uncertainty and unpredictability; assuming the risk is
what investors are paid for. In the case of insurance-linked securities, one of
the ways to reduce the uncertainty is to improve the modelling of hurricanes
and the damage they cause.
There exists a considerable body of research on modelling atmospheric
phenomena such as storms and hurricanes. Catastrophe models used in the
insurance industry and in the analysis of insurance-linked securities are
based on some of this research, as described earlier.
A comprehensive overview of the atmospheric science on which the commercial models are
based would take up a thick volume and cannot be provided here. In most
cases, understanding all of the science is completely unnecessary for an
investor analysing insurance-linked securities. It is important, however, to
have some basic understanding of the science and assumptions used in catastrophe
software packages and avoid treating these tools as black boxes that spit out results based on user input.
Among the many advantages of understanding
the basics of the science and assumptions used by the models is the
ability to better understand the sensitivity of results and the degree of uncertainty
involved. Another important advantage is understanding some of the
differences between the models.
Some elements of the modelling of hurricane risk and related basic scientific
concepts are discussed below. They are not intended to educate a reader
on the hurricane science as such, or even its use in commercial catastrophe
models: rather, the purpose is to provide an illustration of how the models
work, by describing selected issues relevant to the topic.
Modelling hurricane frequency
The number of storms in a hurricane season can be simulated by samplingfrom the hurricane frequency distribution. When the frequency of hurricanes
or hurricane landfalls is modelled directly, there are three main
choices for the probability distribution:
- Poisson;
- negative binomial; and
- binomial.
distributions. Binomial distribution might be appropriate where the sample
variance is less than the sample mean. This is unlikely to be the case in
events with such a high degree of uncertainty as hurricanes; the fact that
there can be several hurricanes during the same time period further complicates
the use of this distribution.
In fact, the variance generally exceeds the mean, leading to the recent adoption by many of the negative binomial as the distribution of choice for hurricane frequency. Most of the standard catastrophe models utilise the negative binomial distribution for hurricane
frequency in Florida; some allow users the choice between Poisson and
negative binomial distributions.
Despite the recent shift towards the use of the negative binomial distribution,
Poisson distribution is still commonly used as well. When considering
the choice of probability distribution for hurricane frequency, parameterisation
might be a bigger issue than the analytical form of the distribution. This
is particularly challenging because of the varying views on the changes in
hurricane frequencies over time.
In fact, the regime switch view of the hurricanefrequency affects both the choice of the parameters of the distribution and the choice of the distribution itself. It is possible that the statistically significant fact of the sample variance exceeding the sample mean is the
result of inappropriately combining in the same sample unadjusted observations
from time periods that have had different mean hurricane
frequencies due to climate oscillations or other changes.
If this is the case, the choice of Poisson distribution over the negative binomial might be preferable. In this context, the choice of the distribution is dependent on the choice
of the distribution mean: if it is determined based on the full historical database
of observations, with all observations given the same weight, negative
binomial distribution seems to almost always outperform Poisson in backtesting
regardless of the geographical region being considered.
Hurricane frequency and intraseasonal correlation
There is an ongoing debate about whether the occurrence of a hurricane, inparticular a major hurricane, during the hurricane season means that there
is a greater probability of another hurricane occurring in the remainder of
the season. In other words, there is a question of whether the frequency
distribution changes if it is conditioned on an occurrence of a hurricane.
The phenomenon in question is sometimes referred to as hurricane clustering.
The rationale for the view that the probability of hurricanes increases
under these circumstances is that a major hurricane is more likely to develop
if the general atmospheric conditions are more conducive than average to
hurricane formation. This in turn implies a greater-than-otherwise-expected
chance of additional hurricanes during the season.
In the analysis of insurance-linked securities, the issue of intra-seasonal
correlation is of particular importance for second-event bonds and second event
catastrophe derivatives. Of course, it is important in ILS analysis in
general for valuation purposes as well as for evaluating opportunities in the
catastrophe bond secondary markets. It could be of even greater consequence
in the context of investment portfolio management.
If the probability of hurricane losses on the US Atlantic coast has increased, it could affect
several securities and have a magnified effect across the portfolio.
In practice, we would be hard pressed to find investors who go through
the process of calculating conditional probabilities of hurricane events. The
standard commercial catastrophe models do not have an easy way to adjust
the probabilities in the middle of a hurricane season based on the occurrence
of an event such as Category 3 hurricane making a landfall in the US or the
Caribbean. There have been attempts to take the intra-seasonal auto correlation
into account in modelling second-event catastrophe bonds.
A better approach than auto correlation models or making adjustments to the frequency distribution based largely on judgement would be to instead
adjust the atmospheric parameters in the model. If the occurrence of a hurricane
was indicative of changing atmospheric conditions, then the best way
to reflect it in the model is by making changes to these assumptions. The
approaches of using auto correlation methods or of making adjustments
based primarily on judgement are also important.
Wind field modelling
Storm track modelling and modelling of the characteristics of the storm arean essential part of the overall hurricane modelling. Characteristics of the
storm at a particular location include central pressure, direction, forward
velocity, maximum winds, air pressure profile and many others.
Some elements of wind field modelling are shown in the following diagram. The
approach shown is just one of many ways to build wind field models.
The important output of wind field models that is used in insurance catastrophe-
modelling software packages is the wind characteristics after
hurricane landfall, at specific locations where insured exposure is located.
Parameterisation of the models is a challenging task that has the potential
to introduce uncertainty and, in some cases, lead to significant errors.
While historical observations are used to calibrate and validate the models, the
sample of observed events is not big enough to credibly estimate a large
number of parameters. A very complex and scientifically sound theoretical
wind field model might be completely useless in practice if it requires estimating
a large number of parameters based on empirical data. This
statement is not limited to wind field models and is applicable to most
elements of hurricane modelling.
Probability distributions of some wind field parameters
In the same way as there are several wind field models, there is more thanone way to model individual parameters used in these wind field models.
Most wind field models use the same general parameters.
Below we look at the examples of probability distributions of some of the stochastic parameters, in particular the ones used in the standard commercial catastrophe
models, as these are of most interest to the practitioner.
Annual frequency
Generating storm formation frequency technically is not part of wind fieldmodelling and comes before it, as does generating hurricane landfall
frequency in most models. Hurricane frequency has been covered above,
Wind field modelling is a critical part of simulating hurricanes and resulting
insurance losses. Various models have been developed; even for the same
model, parameterisation differs from one modeller to another. For illustrative
purposes, below we show selected elements of one of the wind field
models.
Pressure isobars of a cyclone can be modelled as concentric circles
around its centre. One of the standard models for the radial distribution of
surface pressure is

where p(R) is the pressure at a distance R from the centre of the cyclone, p0
is central pressure, Rmax is radius to maximum winds, Dp is the central pressure
difference, and B is a scaling parameter reflective of pressure profile.
There are a number of models for the Holland parameter B, one of the
simplest being B = a + bDp + cRmax , where a, b and c are constant.
is central pressure, Rmax is radius to maximum winds, Dp is the central pressure
difference, and B is a scaling parameter reflective of pressure profile.
There are a number of models for the Holland parameter B, one of the
simplest being B = a + bDp + cRmax , where a, b and c are constant.
In this formulation, dependence on latitude is taken into account indirectly
through other parameters. A popular wind field simulation model is based
on the gradient balance equation of the following form:
through other parameters. A popular wind field simulation model is based
on the gradient balance equation of the following form:

from the cyclone translational direction to the site (clockwise considered
positive), r is the air density, f is the Coriolis parameter and VT is the
cyclone translational speed.
Using the pressure distribution model described above, we obtain the
following formula for gradient wind speed:
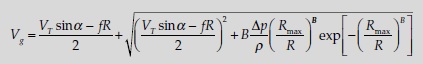
Gradient wind speed Vg can then be used to determine wind speed at
various heights. A number of decay models can be used to simulate the
evolution of wind parameters upon landfall. These will be utilised in calculating
wind gusts over land, taking into account surface roughness and
general topography.
various heights. A number of decay models can be used to simulate the
evolution of wind parameters upon landfall. These will be utilised in calculating
wind gusts over land, taking into account surface roughness and
general topography.
where two functional distribution forms – Poisson and negative binomial –
have been described as the most appropriate, with a general shift to using
the negative binomial distribution because the variance of observed hurricane
frequencies typically exceeds its mean. Parameters of the distribution,
whether negative binomial or Poisson, are estimated based on a smoothing
technique to account for the low number or lack of observations in most
locations.
Landfall locations
If the landfall frequency is estimated directly by location based on one of the
methods described above, there is no need to use any distribution to estimate
landfall location probabilities. Otherwise, given the general hurricane
landfall frequency, the probability of landfall by specific location can be
distributed based on smoothing of empirical data or using a physical model.
Other approaches can be used as well.
Central pressure
Smoothed empirical distributions can be used for central pressure at and
following landfall. The same approach is possible but harder to implement
for modelling hurricane central pressure before landfall. While central pressure
does not easily lend itself to being described by any standard functional
probability distribution, the use of Weibull distribution has produced
acceptable fit. Strong hurricanes are much rarer than the weak ones, and the
Weibull distribution, with properly chosen parameters, captures this relatively
well.
Forward speed
Smoothed empirical distribution specific to a landfall gate is one of the
choices for modelling hurricane forward speed. Similar to the central pressure
distribution, that of forward speed is skewed, with very fast forward
speeds being much less common than slower speeds. However, based on
historical observations, the degree of skewness is generally lower.
Lognormal distribution is a good choice for modelling storm forward speed
in most situations.
Radius to maximum winds
Lognormal distribution can be used for modelling Rmax, with its parameters
depending on central pressure and location latitude. The lognormal distribution
needs to be truncated to avoid generating unrealistic values of Rmax.
depending on central pressure and location latitude. The lognormal distribution
needs to be truncated to avoid generating unrealistic values of Rmax.
Gamma distribution has also been used for stochastically generating radius
to maximum winds, producing acceptable results when limited to modelling
the Rmax variable at landfall as opposed to including its modelling over
open water. Another way to generate Rmax values is by using one of the
models where logarithm of Rmax is a linear function of central pressure
(and/or its square) and location latitude.
Coefficients in the linear relationships are determined based on empirical data. Then Rmax is not simulated directly, but rather is calculated as a function of latitude and the simulated
value of central pressure. Other models can also be used.
These are just some of the random variables simulated in catastrophe
models. Many others need to be modelled, including such important ones as
wind dissipation overland, in order to ultimately derive hurricane physical
parameters after a landfall.
DAMAGE MODELLING
In catastrophe models, the next step after simulating physical effects of a
hurricane (such as peak gusts and flood depth at specific locations) is determining
the damage they cause. Conceptually, this process is very
straightforward. It involves the following basic steps:
1. For each individual location in the insured exposure database,
consider
- simulated physical characteristics of the storm that are relevant to estimating potential damage;
- characteristics of the insured property at the location.
2. Identify the damage functions corresponding to the hurricane’s physical
parameters (peak gusts) and the vulnerability classes of insured
buildings and contents at the location.
3. Apply the damage functions to the replacement value of the insured
property to calculate the loss.
Detailed information on the insured property is essential for assessing its
vulnerability to hurricanes. The information should include the following,
in as great detail as possible:
- precise location of the insured property (street address, ZIP code, CRESTA, etc.);
- vulnerability characteristics (construction type, height and footprint size, year of construction, occupancy type, mitigating factors, etc.); and
- replacement property value.
analysis. Their details represent a highly proprietary component of
commercial catastrophe models that can be a significant differentiator
among the models. The exact definition of a vulnerability function is the
relationship between the mean damage ratios and the peak gusts, where the
mean damage ratio relates the expense of repairing the damaged property
to the replacement cost of the property.
Modifications to vulnerability functions or subsets of vulnerability functions
can be based on secondary characteristics or mitigation measures such
as roof type, roof strength, roof-to-wall strength, wall-to-floor and wall-tofoundation
strength, opening protection and others. The variables are
largely the same for all models since they are a function of the type of exposure
information collected by insurance companies.
The way vulnerability functions are determined and modified differs, sometimes significantly,
from one model to another. Some models use additional variables such as
wind duration to better estimate damage to insured property from hurricanes.
The fact that damage modelling follows very simple and logical steps
does not imply the ease of building a module for its calculation as part of a
catastrophe model.
The effort going into determining and refining vulnerability
functions cannot be overestimated. Complex structural engineering
studies have been conducted for this purpose and a large amount of historical
hurricane damage data has been analysed. This is a continuing process
as more precise site information becomes available, building codes change
and other developments take place.
FINANCIAL LOSS MODELLING
Once the damage for each insured location has been calculated, it can thenbe translated into the amount of insured loss by applying to it policy terms
and conditions including its deductible and limit. Loss triggers, insurance
coverage sublimits and other factors are also taken into account in the calculations;
for reinsurance purposes, other factors such as attachment point are
also part of the loss calculations.
This process too is very straightforward in
its implementation as long as all the necessary data inputs are reliable.
Adjustments to the process, when such are required, can introduce a
degree of complexity. Adjustments include taking into account demand
surge following a catastrophic event.
WIND AND EARTHQUAKE STRUCTURAL ENGINEERING ANALYSIS
The ability to estimate potential damage to insured structures depending onthe physical characteristics of a hurricane or an earthquake is a challenging
structural engineering task. Two separate disciplines, hurricane engineering
and earthquake engineering, have developed to deal with engineering
aspects of hurricane and earthquake hazards.
While the broader focus of the disciplines is on designing, constructing and maintaining buildings and infrastructure to withstand the effects of catastrophic events, in insurance
catastrophe modelling the emphasis is on quantifying the damage that
would result from hurricanes and earthquakes of various intensities. Similar
principles can also be applied to the risk of manmade catastrophic events
such as acts of terrorism.
Estimating the dependence of mean damage ratios on hurricane peak
gusts or earthquake physical characteristics for various types of structures is
the process of constructing vulnerability functions, which are an essential
part of the damage calculator in insurance catastrophe models.
Constructing sets of vulnerability functions for specific geographical areas
is necessary to take into account the overall topography, building codes
and the history of their change over time, and other factors.
Demand surge
A catastrophic event such as a hurricane landfall or an earthquake can resultin the increase of costs of repairing the damage and other expenses covered
by insurance policies above the level of claim costs expected under normal
circumstances. This effect is referred to as demand surge, reflective of the
increase in costs being driven by a sharp increase in demand while the
supply lags behind.
An example is the shortage of building materials following a major hurricane, when many properties are damaged and all of them require building materials for restoration, all at the same time immediately following the hurricane. The cost of building materials naturally
goes up to reflect the demand–supply imbalance created by catastrophic
events.
The post-event shortage expands to the labour costs, which also
affect the cost of rebuilding the damaged property. Additional living
expenses can also grow after a large catastrophic event, further contributing
to losses suffered by insurance companies.
To account for demand surge, insurance catastrophe models can apply
special demand surge or loss amplification factors to insurance losses. The greater the magnitude of a catastrophic event, the greater the demand surge
effect. The effect applies to different parts of insurance coverage to different
degrees; consequently, demand surge factors differ as well. Sometimes the
factors are further refined to reflect the various degrees of the demand surge
effect, for example on the cost of rebuilding various types of property.
Aggregate approach
An aggregate approach, as opposed to the more detailed location-by-locationmodelling, starts before the financial loss module, in the analysis of
hurricane damage. The goal here is to arrive at aggregate insured losses for
an individual risk portfolio or even for the whole insurance industry. In this
approach, portfolio-level information is used in the calculations to arrive at
the loss distribution, as opposed to analysing each individual risk independently
and then aggregating the losses across the portfolio.
Inventory databases of property exposure are utilised to help accomplish this goal,
with the data aggregated by location (such as ZIP or postal code) and
including information on the types of property, vulnerability degrees, type
of coverage, etc. The calculations consider aggregate exposure data by location,
estimate the average damage and then translate it into financial losses.
When this is done not for an individual portfolio of a specific insurance
company but for the whole insurance industry, the result is a figure for
industry-wide losses by geographic area (for example, all of Florida), the
probability distribution of which is important for larger primary insurance
writers, and even more important for reinsurance companies.
There are other ways to calculate aggregate losses, which are based on
more granular analysis and the use of databases of insurance policies from
several insurance companies, and then extrapolating the losses to the total
insurance industry based on insurance premiums or another measure of
exposure. Some modelling companies might have developed such databases
by combining data from the companies that provided them with this
information.
In the context of insurance-linked securities, aggregate losses suffered
by the insurance industry are important in catastrophe bonds with an
industry loss trigger, in industry loss warranties (ILWs) and in catastrophe
derivatives.

auto Insurance always a high priority concern for all the drivers they know and understand how important it is for them, the best car insurance for young drivers is here
ReplyDeleteVery insightful article. It shows clearly where the industry needs improvement
ReplyDelete